Status #
GitHub Apps #
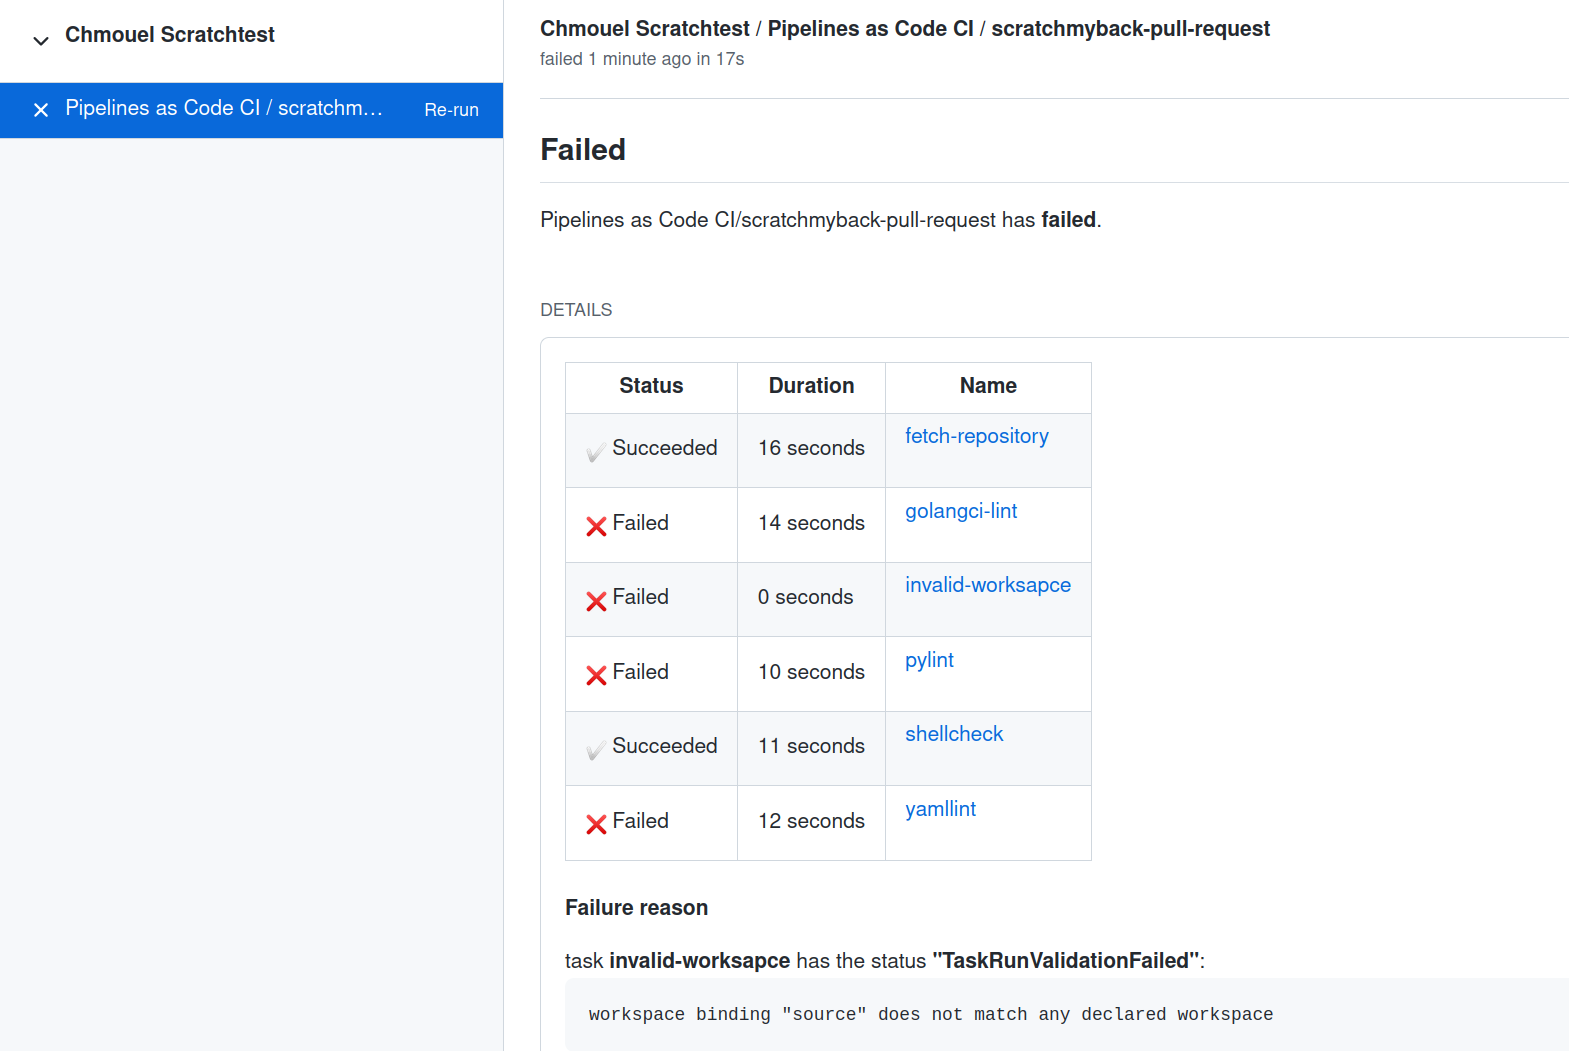
After the PipelineRun has finished, its status will be
shown in the GitHub Check tabs, along with a concise overview
of the status, the name, and the duration of each task in the pipeline. If the task has a
displayName
it will use it as the description of the task or otherwise just the task
name.
If any step fails, a small portion of the log from that step will also be included in the output.
In case an error is encountered while creating the PipelineRun on the cluster,
the error message reported by the Pipeline Controller will be conveyed to the
GitHub user interface. This facilitates the user to swiftly identify and
troubleshoot the issue, without having to navigate to the underlying
infrastructure.
Any other error that may arise during the execution of the pipeline will also be reported to the GitHub user interface. However, if there was no match for the namespace, the error will be logged in the Pipelines-as-Code Controller’s logs.
Statuses for other providers (Webhook based) #
If the webhook event pertains to a pull request, it will be included as a comment to the corresponding pull or merge request. However, when it comes to push events, it is not feasible to exhibit the status of the PipelineRun as there is no dedicated space to showcase it. In such scenarios, you can employ alternate methods as enumerated below.
Log Snippet when reporting error #
If an error is detected in one of the tasks in the Pipeline, a brief excerpt of the last three lines from the task breakdown is displayed. However, the API has a character limit that restricts us to output only the output of the first failed task.
To prevent exposing secrets, Pipelines-as-Code analyzes the PipelineRun and replaces secret values with hidden characters. This is achieved by retrieving all secrets from the environment variables associated with tasks and steps, and searching for matches of these values in the output snippet.
These matches are first sorted by length and then replaced with a
"*****" placeholder in the output snippet. This ensures that the output
will not contain any leaked secrets.
The hiding of the secret does not support concealing secrets from workspaces
and
envFrom
sources.
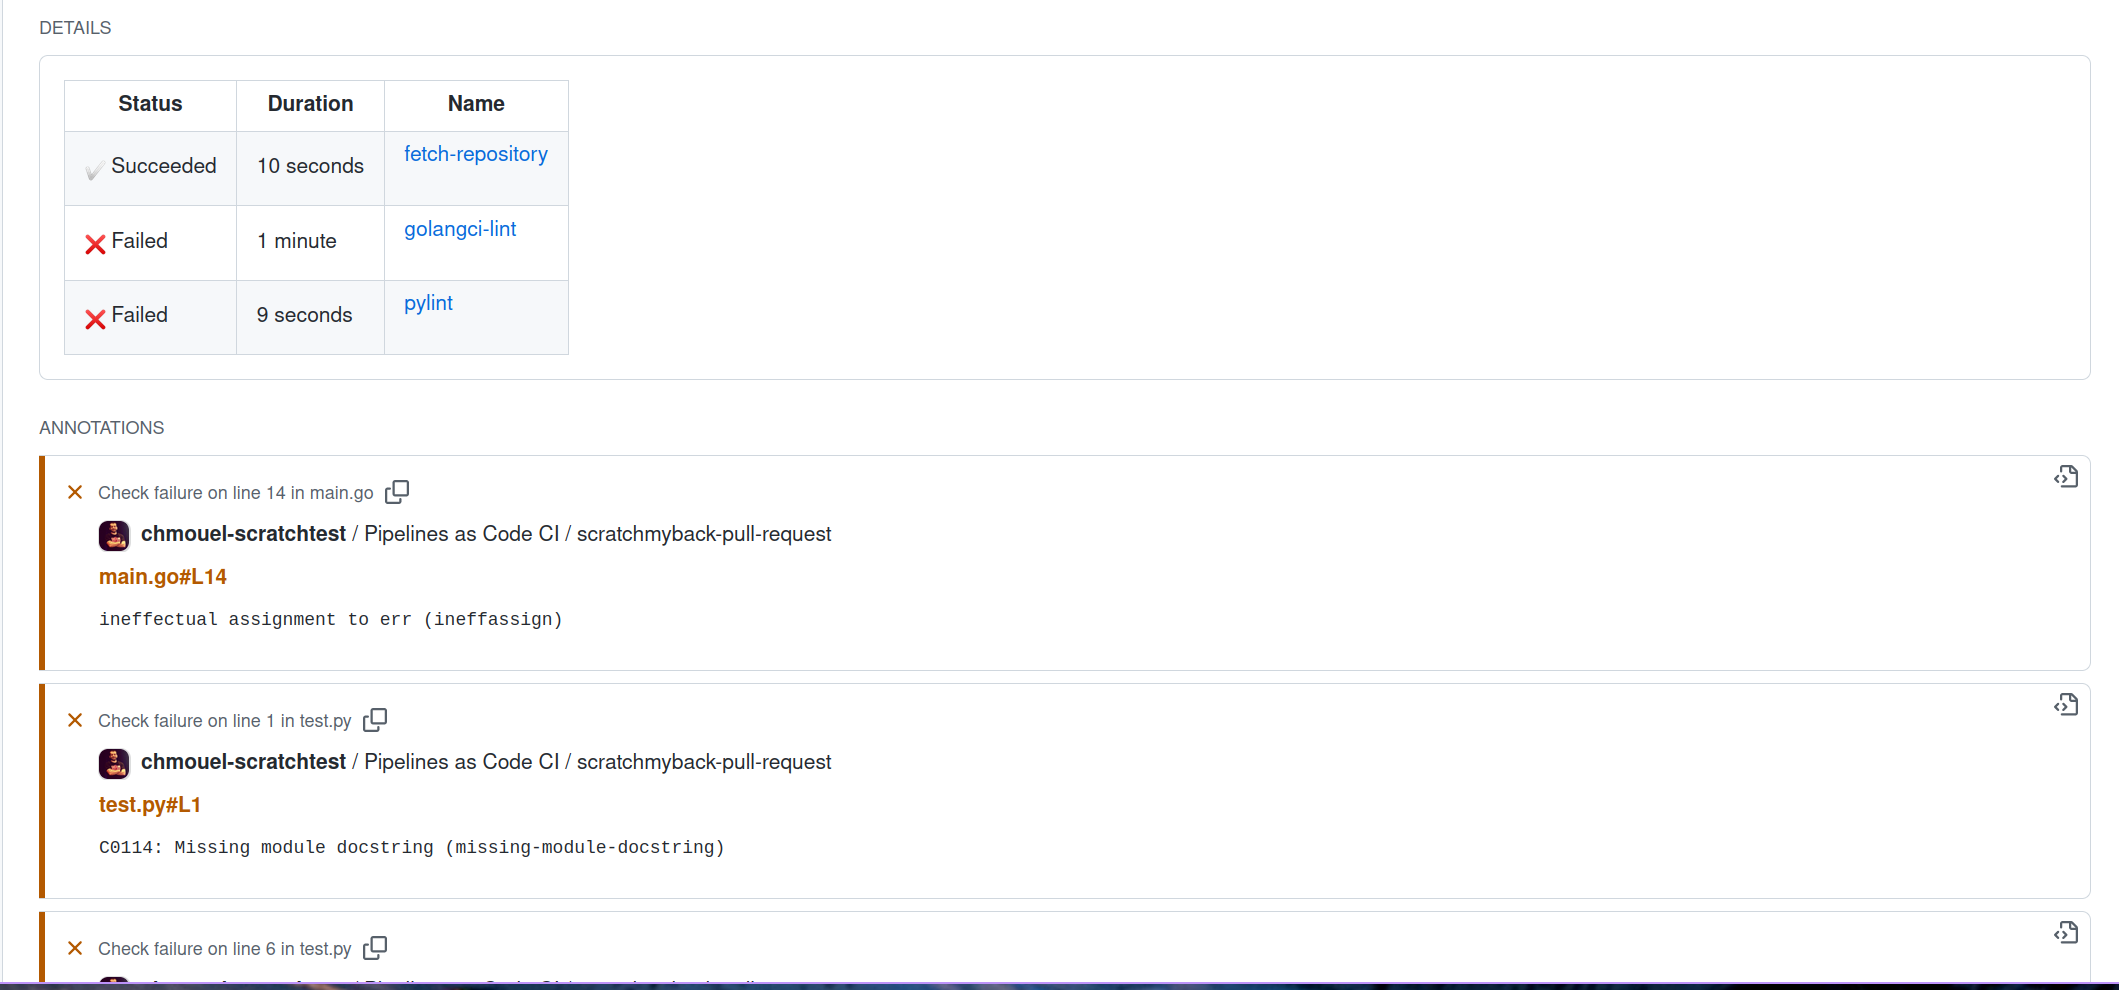
Error detection from containers logs as GitHub Annotation #
If you enable the error-detection-from-container-logs option in the
pipelines-as-code ConfigMap, Pipelines-as-Code will attempt to detect
errors from the container logs and add them as annotations on the corresponding
Pull Request where the error occurred.
Currently, only a simple error format such as those resembling makefile or
grep output are supported, specifically the format of :
filename:line:column: error message
Tools like golangci-lint, pylint, yamllint, and many others can
produce errors in this format.
You can refer to the Pipelines-as-Code pull_request.yaml for an example of how we lint our code and output errors in the specified format.
You can customize the regular expression used for detecting errors with the
error-detection-simple-regexp setting. The regular expression uses named
groups to provide flexibility
in specifying the matching criteria. The necessary groups for matching are
filename, line, and error (the column group is not used). The default regular
expression is defined in the configuration map.
By default, Pipelines-as-Code searches for errors in only the last 50 lines of
the container logs. However, you can increase this limit by setting the
error-detection-max-number-of-lines value. If you set this value to -1, the
system will search through all available lines for errors. Keep in mind that
increasing this maximum number of lines may increase the memory usage of the
watcher.
Namespace Event stream #
When a namespace has been matched to a repository, Pipelines-as-Code will emit its log messages as Kubernetes events within the namespace of the corresponding repository.
Repository CRD #
The most recent five statuses of any PipelineRuns associated with a repository are stored within the corresponding repository custom resource (CR).
Thepipelinerun_statusfield in theRepositoryCR is scheduled for deprecation and will be removed in a future release. Please avoid relying on it.
% kubectl get repo -n pipelines-as-code-ci
NAME                  URL                                                        NAMESPACE             SUCCEEDED   REASON      STARTTIME   COMPLETIONTIME
pipelines-as-code-ci   https://github.com/openshift-pipelines/pipelines-as-code   pipelines-as-code-ci   True        Succeeded   59m         56m
Using the tkn pac describe command from the cli you can easily view all of the statuses of the PipelineRuns associated with your repository, as well as their metadata.
Notifications #
Notifications are not managed by Pipelines-as-Code.
To add notifications to your PipelineRuns, you can use the finally feature of Tekton Pipelines. This allows you to execute a set of tasks at the end of a PipelineRun, regardless of whether it succeeds or fails.
As an example, you can refer to the coverage generation PipelineRun in the
.tekton directory of the Pipelines-as-Code repository, it uses the finally
task with the guard
feature
to send a notification to Slack if there is any failure in the PipelineRun. See
it in action here: