Metrics Overview #
The metrics for pipelines-as-code can be accessed through the pipelines-as-code-watcher service on port 9090.
pipelines-as-code supports various exporters, such as Prometheus, Google Stackdriver, and more. You can configure these exporters by referring to the observability configuration.
| Name | Type | Labels/Tags | Description |
|---|---|---|---|
pipelines_as_code_git_provider_api_request_count | Counter | provider=<git_provider>event-type=<event_type>namespace=<pipelinerun_namespace>repository=<repository_cr_name> | Number of API requests submitted to git providers |
pipelines_as_code_pipelinerun_count | Counter | provider=<git_provider>event-type=<event_type>namespace=<pipelinerun_namespace>repository=<repository_cr_name> | Number of pipelineruns created by pipelines-as-code |
pipelines_as_code_pipelinerun_duration_seconds_sum | Counter | namespace=<pipelinerun_namespace>repository=<repository_cr_name>status=<pipelinerun_status>reason=<pipelinerun_status_reason> | Number of seconds all pipelineruns have taken in pipelines-as-code |
pipelines_as_code_running_pipelineruns_count | Gauge | namespace=<pipelinerun_namespace>repository=<repository_cr_name> | Number of running pipelineruns in pipelines-as-code |
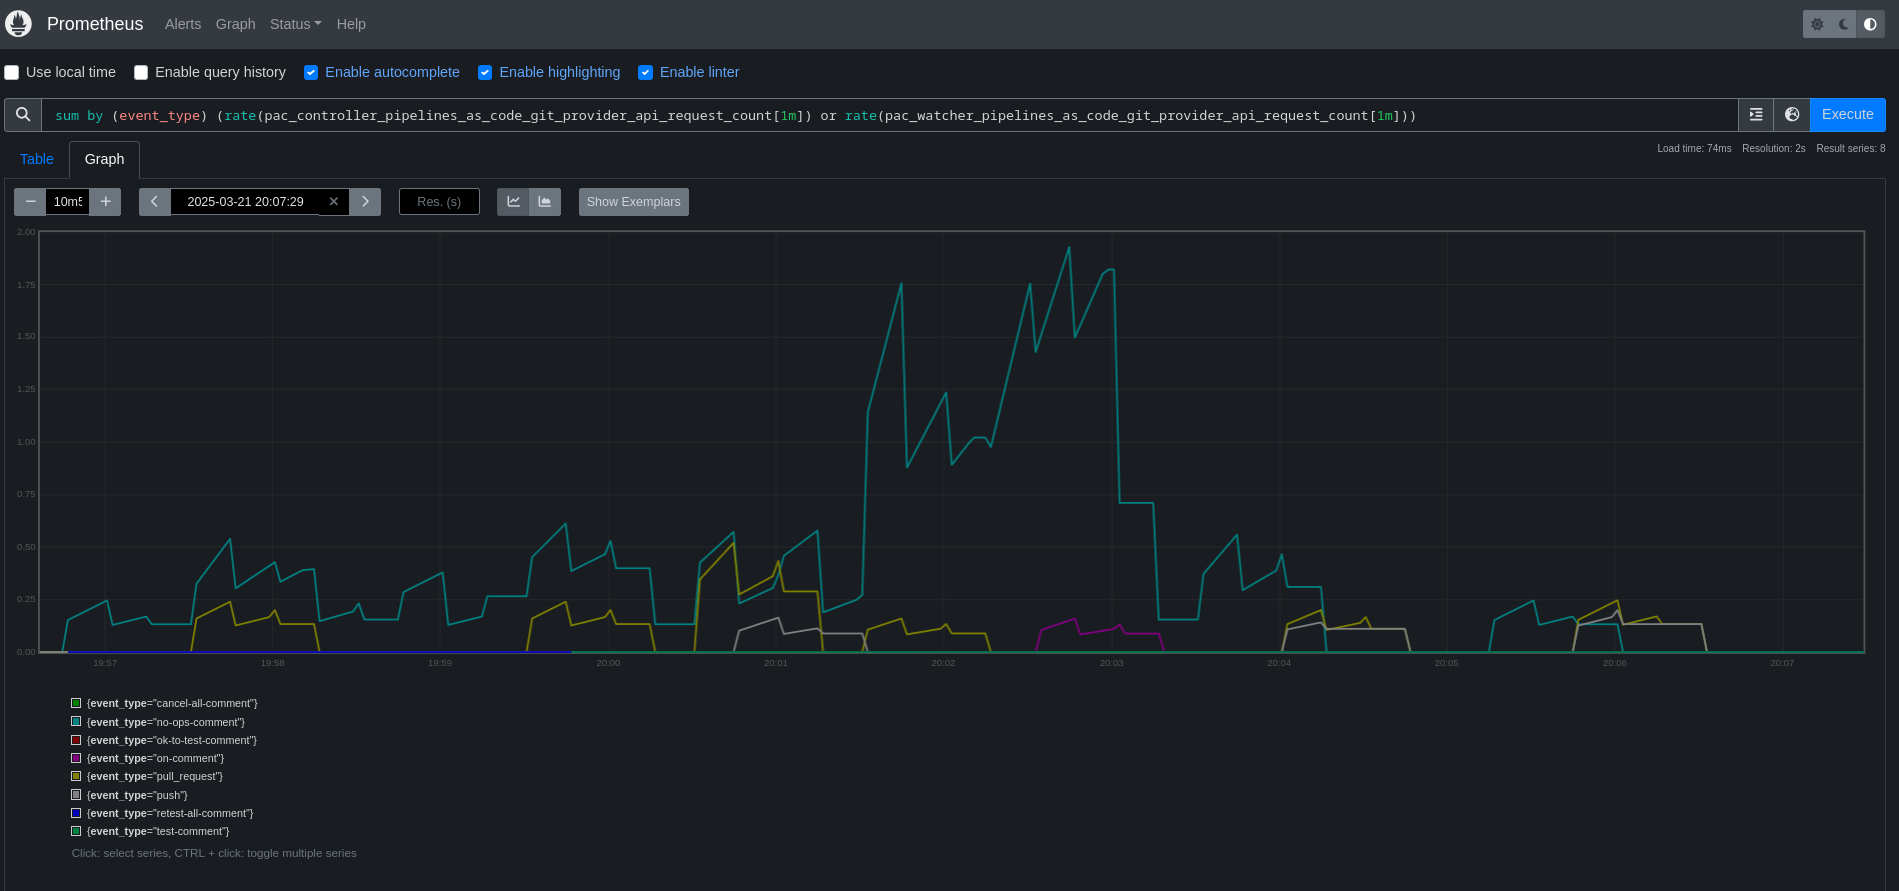
Note: The metric pipelines_as_code_git_provider_api_request_count
is emitted by both the Controller and the Watcher, since both services
use Git providers’ APIs. When analyzing this metric, you may need to
combine both services’ metrics. For example, using PromQL:
sum (pac_controller_pipelines_as_code_git_provider_api_request_count or pac_watcher_pipelines_as_code_git_provider_api_request_count)sum (rate(pac_controller_pipelines_as_code_git_provider_api_request_count[1m]) or rate(pac_watcher_pipelines_as_code_git_provider_api_request_count[1m]))